Here are the July/2017 MLS single-family statistics for Austin, TX:
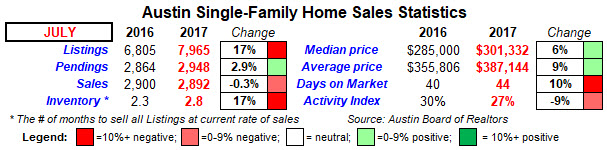
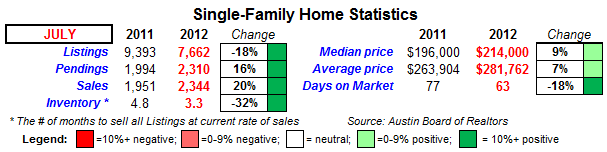
The shift out of Austin’s strong seller’s market continued--for the 5th month in a row--in July with the same red categories (going against sellers) of Listings, Inventory, Days on Market and Activity Index. However, we also had sales drop, just barely, in July which is the 2nd time this year. Keep in mind that we had negative home sales trends in 4 of the last 6 months of 2016, too. Compare last month to July of 2012 (below) which was a year after Austin’s market turned into a seller’s market (March/2011). Even though our sales, inventory, days on market, and activity index numbers were worse then than last month, 2012 signified a surging market (from the perspective of sellers) while last month represents one that is slowing down.
I expect this trend to continue, but there is no way to determine how long it will last or how deep it will go. As with the stock market, we never know when the peak was until after the fact. We won’t know if this shift in our market is just over several months or whether we go into a full-blown buyer’s market that lasts a year or two. Given the strength of Austin’s economy and the popularity of central Texas, I’m betting it won’t last too long or go too deep. Regardless, if you have a home to sell: Make sure you have it in great shape; staged well; with good curb appeal; use a strong Realtor that promotes your home with professional photos, walk-thru video, and markets it heavily on the internet; and, price your home to the future market--ie, one that will likely see softening prices. Now is not the time to “test the market” with higher than average pricing.
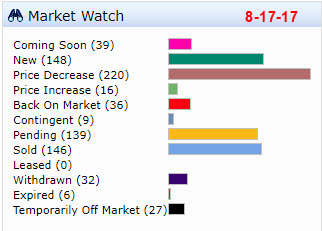
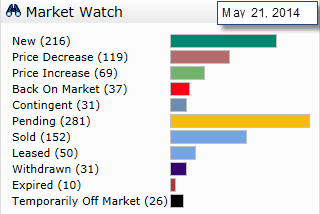
Below are 2 pictures that reflect our slowing market...these come from our MLS and show us Realtors what has happened in the Austin metro for the previous 24 hours. As you can see, price decreases are much higher than new, pending or sold listings now, but were just the opposite 3 years ago.